
Interactive Charts
Interactive charts combine candlesticks, execution markers, and indicators drawn by your strategy. Backtests show the complete simulated history, while paper and live charts update as the session runs and remain available afterward.
Chart controls
- Move the cursor over a candle to see its OHLC and indicator values.
- Click an indicator name in the candle-chart legend to hide or show its line. This preference is remembered for each strategy.
- Click a pane header to collapse or expand it. Double-click it to show only that pane, or use Collapse all to give the candle chart more room.
- Pan or zoom any pane to keep the candle chart and indicator panes synchronized.
- Use Reset view to fit the data or Save as image to export the chart.
- Paper and live charts support fullscreen mode. Press
Escto exit.
Reviewing completed trades
Open Trade Chart from a backtest, paper, or live session to review completed trades and their executions alongside price action.
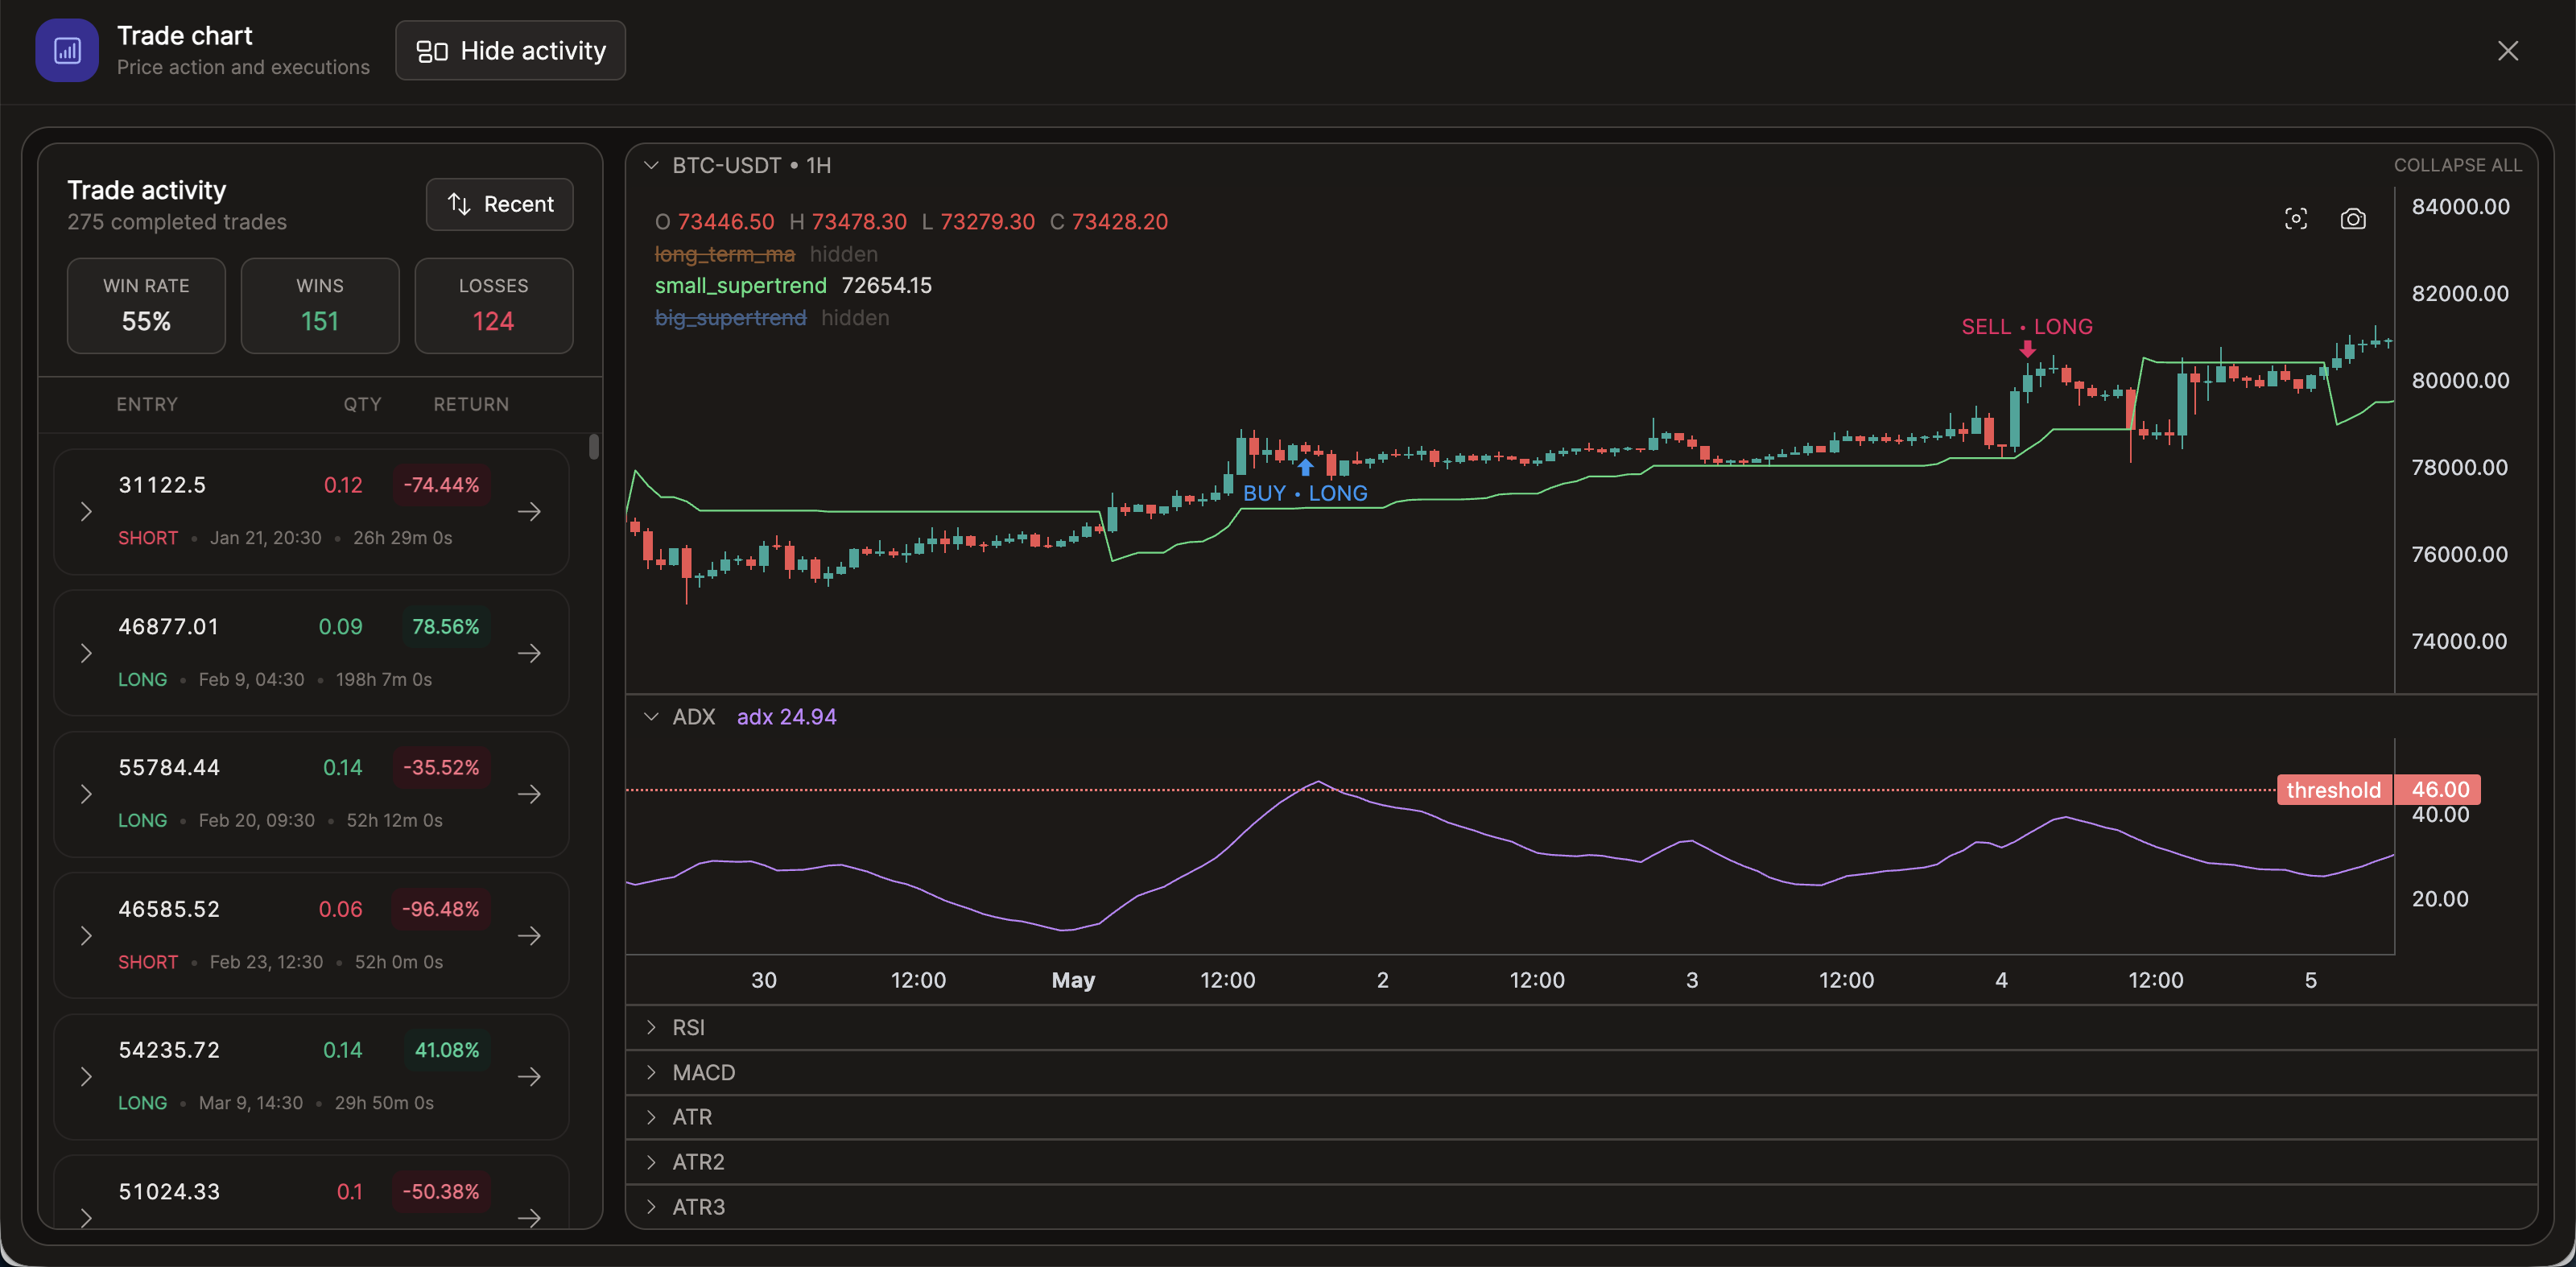
- Sort trades by recent, best, or worst performance.
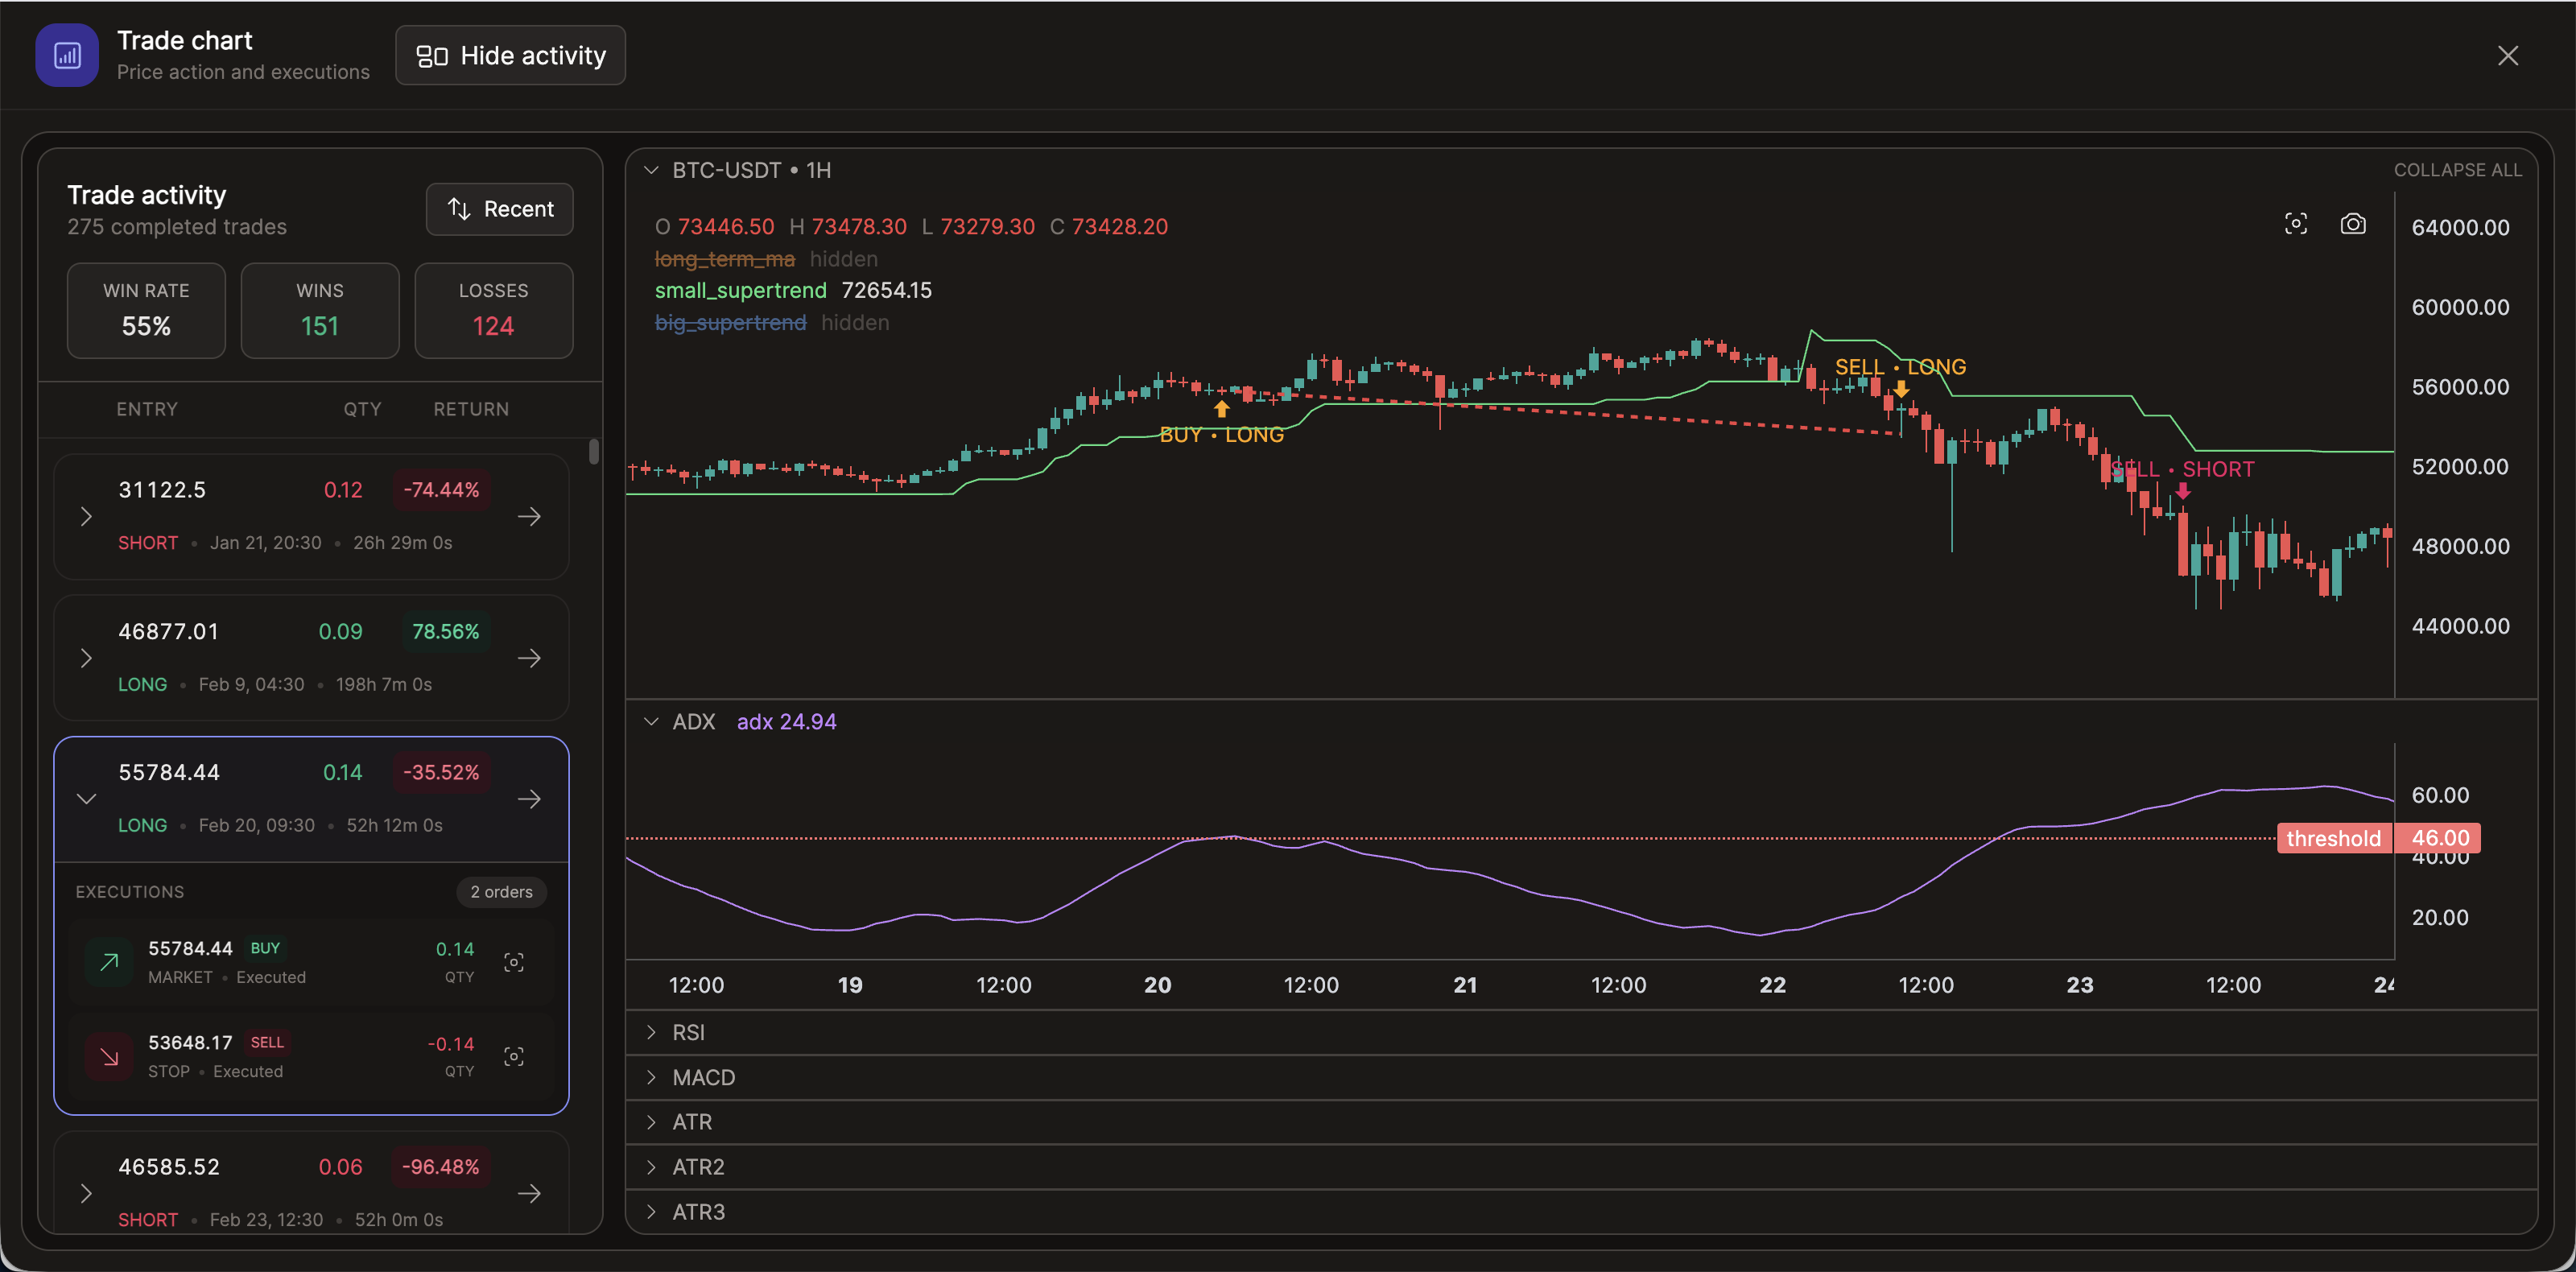
- Select a trade to center the chart on it, or expand it to inspect individual executions.
- Use Hide activity for a wider chart. For multi-route sessions, use the route selector to switch charts.
Plotting indicators with update_chart()
Define update_chart() in your strategy and call the chart methods from it. Jesse runs it once per backtest candle and updates it during paper and live sessions so indicators can follow the forming candle.
import jesse.indicators as ta


def update_chart(self) -> None:
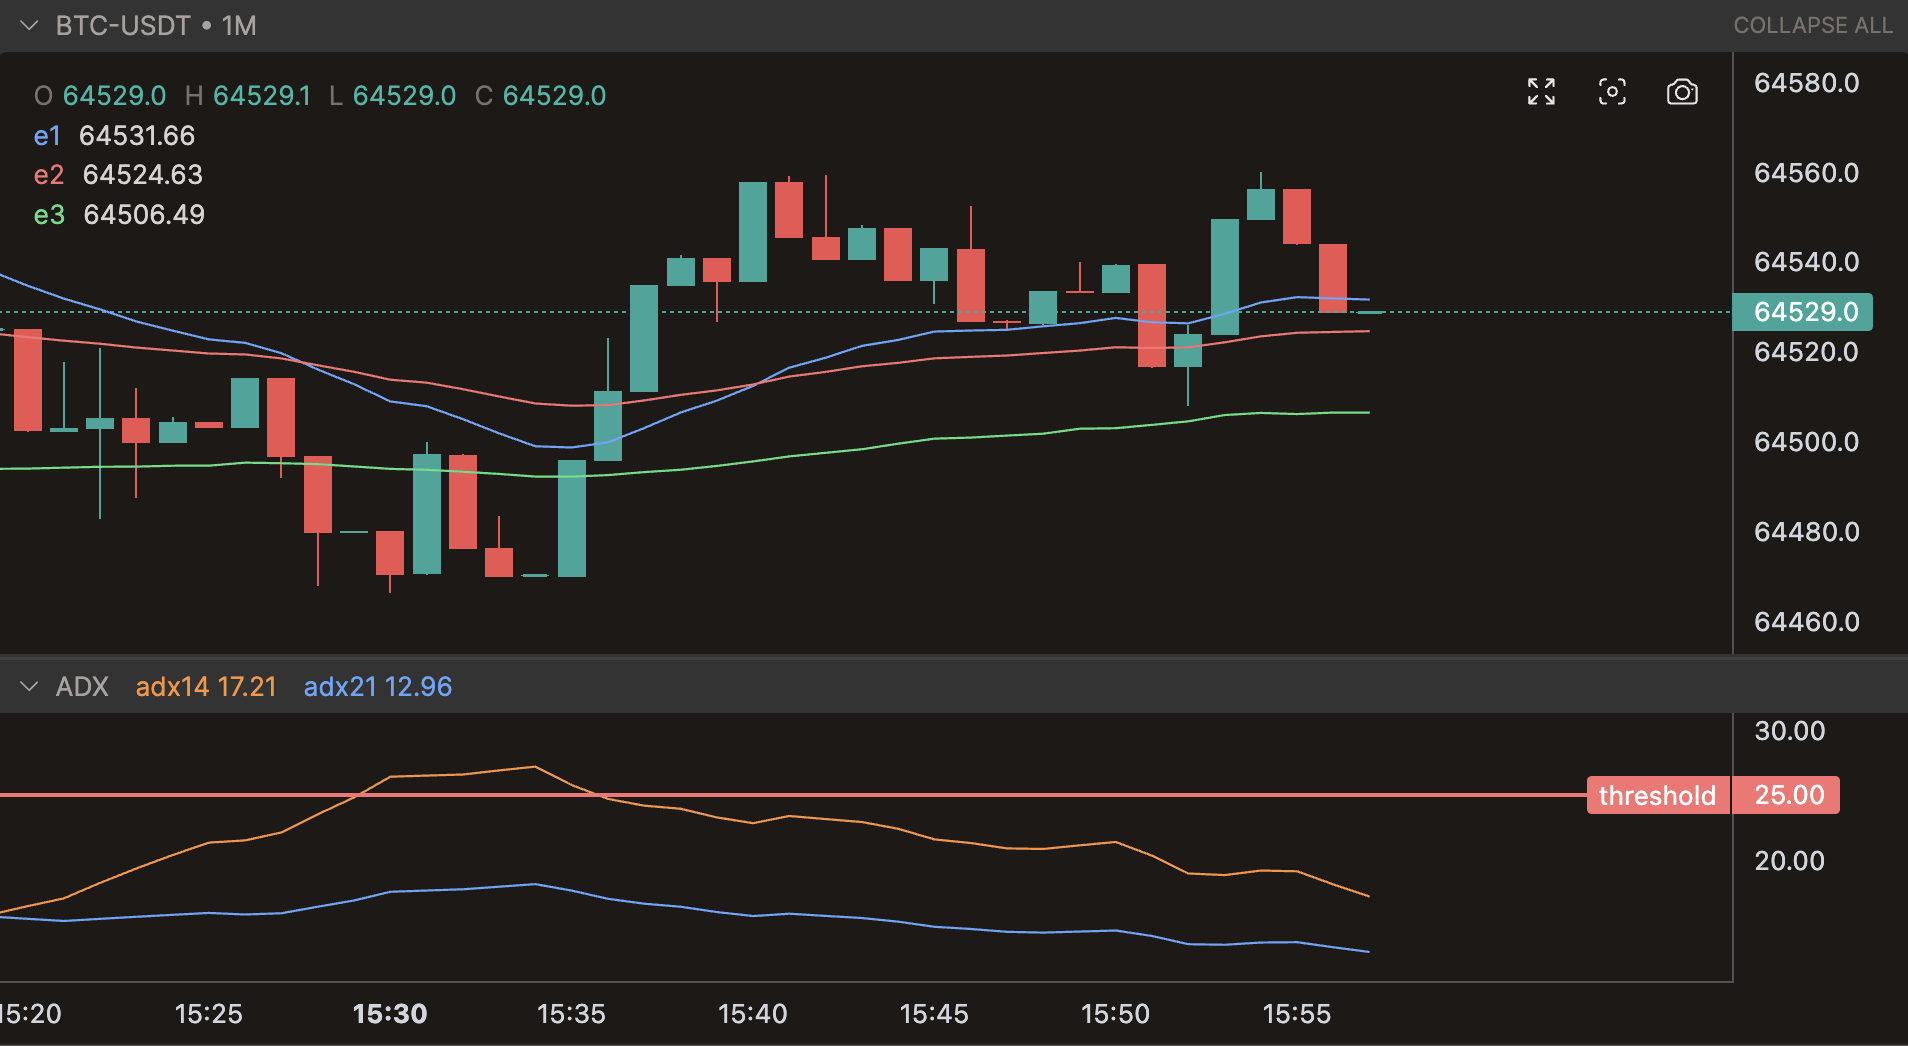
    self.add_line_to_candle_chart('ema50', ta.ema(self.candles, 50), color='blue')
    self.add_horizontal_line_to_candle_chart('support', 60_000, color='green')

    self.add_extra_line_chart('ADX', 'adx14', ta.adx(self.candles, 14), color='orange')
    self.add_extra_line_chart('ADX', 'adx21', ta.adx(self.candles, 21), color='blue')
    self.add_horizontal_line_to_extra_chart('ADX', 'threshold', 25, color='red')
Colors
Colors such as blue, red, and green adapt to light and dark themes. Use a CSS value such as color='#2563EB' for an exact shade.
WARNING
Use update_chart() only to calculate and draw chart values. Do not submit orders or change strategy state from it.
Use update_chart() for forming-candle updates. In live trading, chart calls in before() or after() update only after a route candle closes.
Live chart history
Live charts start indicator history from the current candle instead of replaying warm-up candles. Saved history remains available in Trade Chart after the session ends; backtests keep their complete chart history.
add_line_to_candle_chart()
Adds a time-series line on top of the candlestick chart. This is appropriate for values that share the market's price range, such as moving averages or Supertrend.
Arguments:
title: str: Unique name displayed in the legend.value: float: Value for the current candle.color=None: Line color. Jesse generates a color when omitted.
def update_chart(self) -> None:
    self.add_line_to_candle_chart(
        'supertrend',
        ta.supertrend(self.candles).trend,
        color='purple',
    )
    self.add_line_to_candle_chart('ema50', ta.ema(self.candles, 50), color='blue')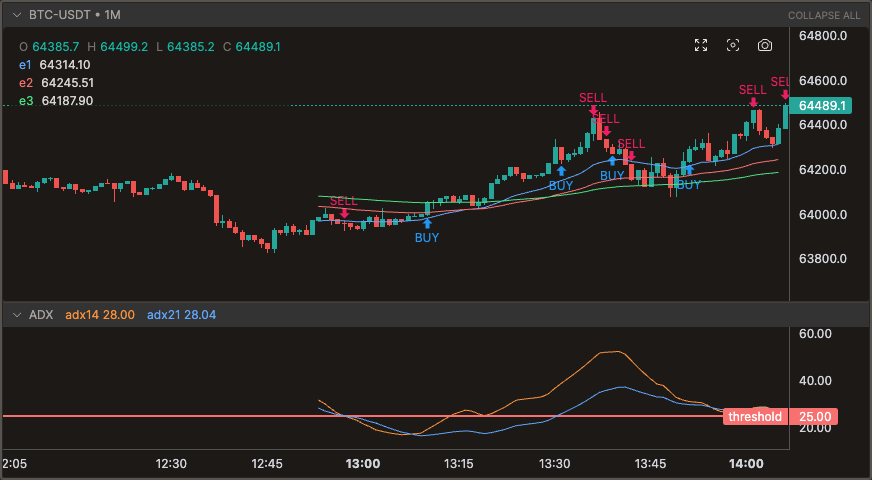
add_horizontal_line_to_candle_chart()
Adds or updates a named horizontal level on the candlestick chart. Reusing the same title moves the existing level instead of creating another one.
Arguments:
title: str: Unique name displayed on the price scale.value: float: Price of the horizontal level.color=None: Line color. Jesse generates a color when omitted.line_width=1.5: Width of the line.line_style='solid': Either'solid'or'dotted'.
def update_chart(self) -> None:
    self.add_horizontal_line_to_candle_chart('resistance', 65_000, color='red')
    self.add_horizontal_line_to_candle_chart('support', 60_000, color='green')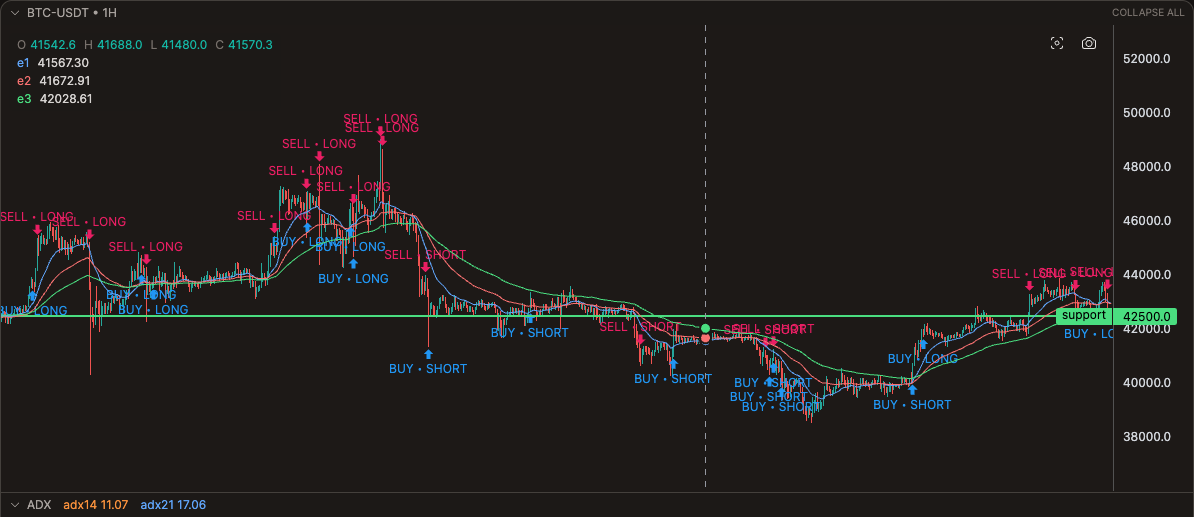
add_extra_line_chart()
Adds a time-series line to a separate indicator pane. Use this for values whose scale differs from the market price, such as RSI or ADX. Lines with the same chart_name are placed in the same pane.
Arguments:
chart_name: str: Name of the indicator pane.title: str: Unique line name displayed in the pane header.value: float: Value for the current candle.color=None: Line color. Jesse generates a color when omitted.
def update_chart(self) -> None:
    self.add_extra_line_chart('RSI', 'rsi14', ta.rsi(self.candles, period=14), color='orange')
    self.add_extra_line_chart('RSI', 'rsi21', ta.rsi(self.candles, period=21), color='blue')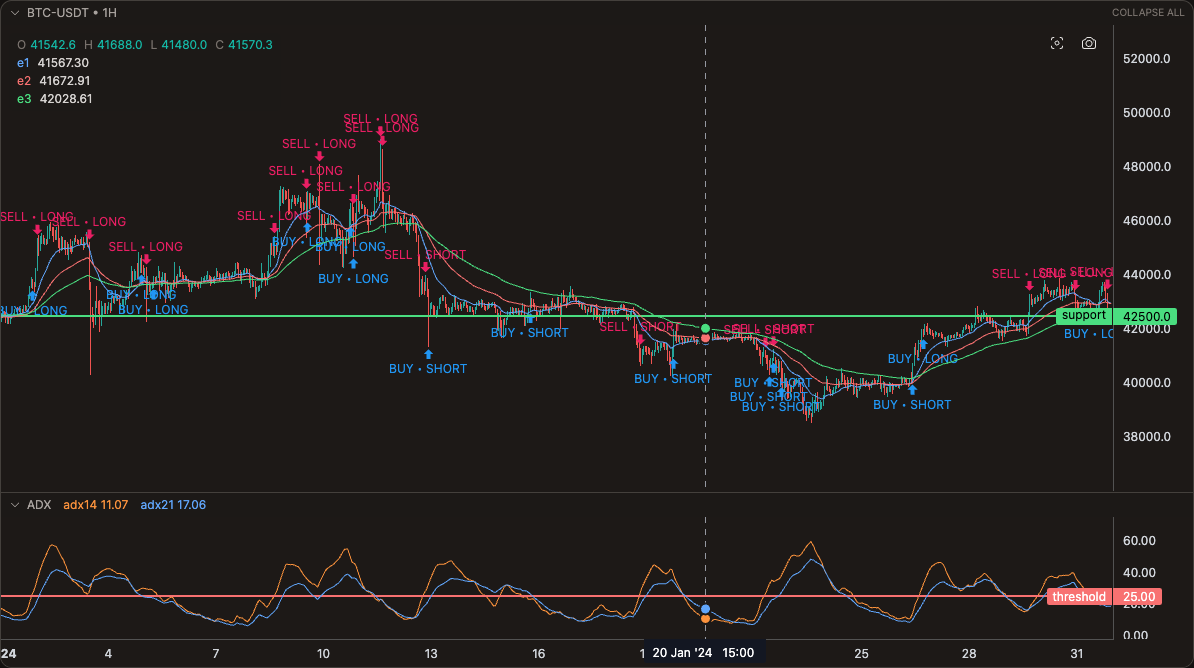
add_horizontal_line_to_extra_chart()
Adds or updates a named horizontal level inside an indicator pane. The chart_name must match the name passed to add_extra_line_chart().
Arguments:
chart_name: str: Name of the existing indicator pane.title: str: Unique name for the horizontal level.value: float: Value of the horizontal level.color=None: Line color. Jesse generates a color when omitted.line_width=1.5: Width of the line.line_style='solid': Either'solid'or'dotted'.
def update_chart(self) -> None:
    self.add_extra_line_chart('RSI', 'rsi14', ta.rsi(self.candles, period=14), color='orange')
    self.add_extra_line_chart('RSI', 'rsi21', ta.rsi(self.candles, period=21), color='blue')
    self.add_horizontal_line_to_extra_chart('RSI', 'overbought', 70, color='red')
    self.add_horizontal_line_to_extra_chart('RSI', 'oversold', 30, color='green')