Charts
Jesse provides charts for inspecting strategy behavior during backtests and while paper or live trading.
Interactive Charts
The Interactive Charts view combines candlesticks, executed-order markers, strategy-added indicator lines, horizontal levels, and separate indicator panes. Backtest charts display the completed simulation, while live charts stream the current candle and strategy values as the session runs.
Backtest Result Charts
The Backtest Result Charts summarize performance through cumulative returns, drawdowns, monthly returns, and trade P&L distributions.
Equity Curve
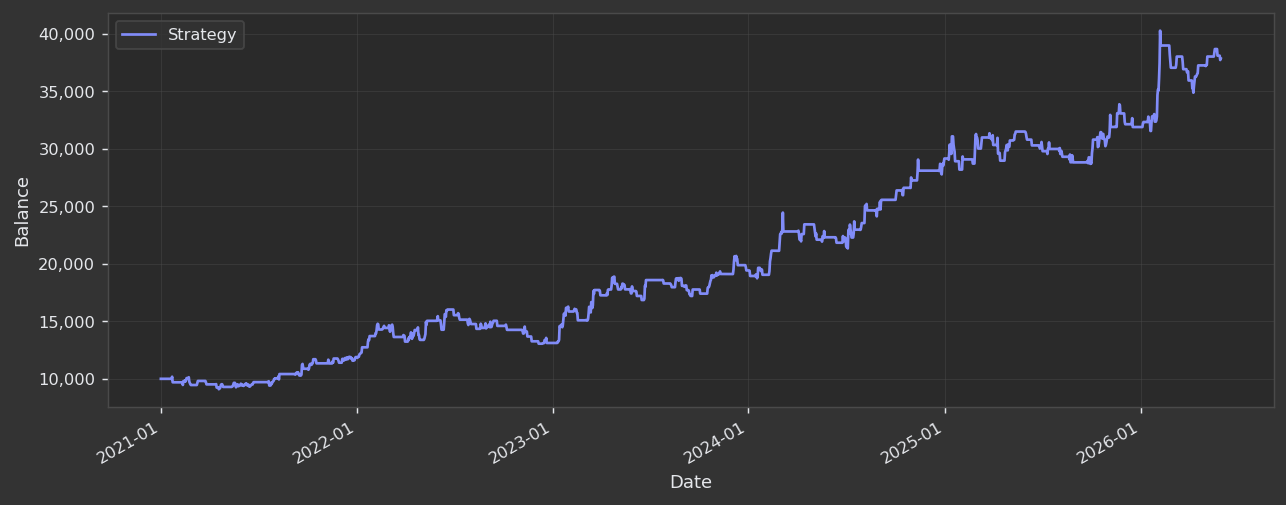
After the backtest simulation is finished, you will get to see the equity curve of your daily balances. Here is how it looks:
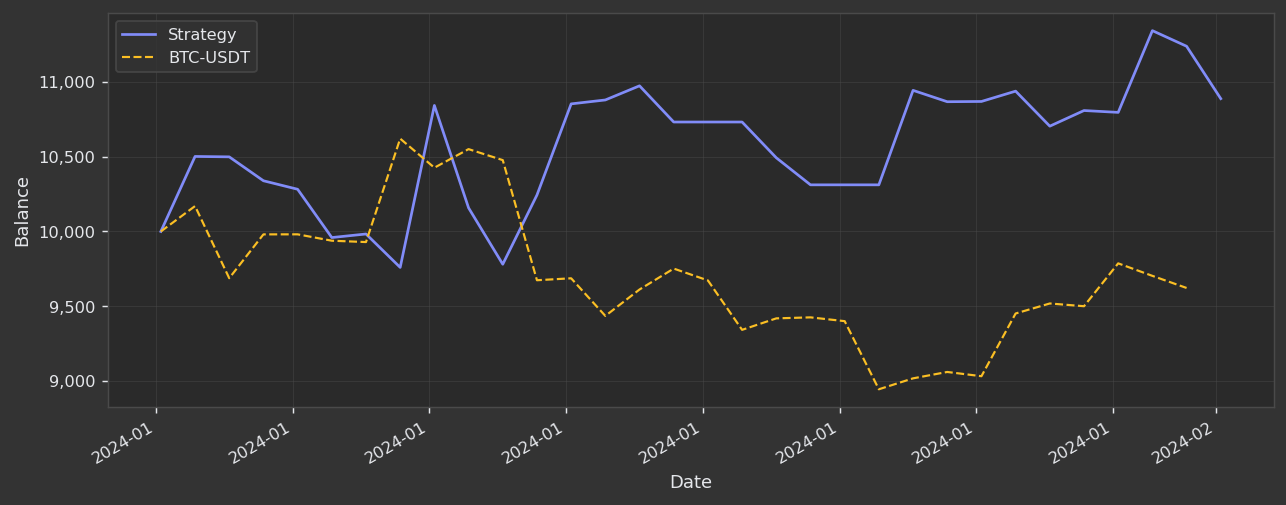
You can also enable the benchmark feature to compare your equity curve to a buy-and-hold strategy for the assets you are trading.