
Benchmark
✨ Premium Feature
The Benchmark feature is available to Jesse premium subscribers only. Upgrade your plan to unlock it.
The Benchmark feature lets you run multiple backtest configurations simultaneously and view their results side by side in a structured comparison table. Instead of running one backtest at a time and manually noting down results, Benchmark automates the entire workflow so you can evaluate dozens of configurations in a single session.
What Is It For?
Benchmark is designed for situations where you want to compare strategies, parameters, symbols, or timeframes against each other systematically. Common use cases include:
- Testing the same strategy across multiple symbols (e.g.
BTC-USDT,ETH-USDT,SOL-USDT) to find which markets it performs best on - Comparing a strategy with different parameter sets before committing to a full optimization
- Running a final validation sweep across several timeframes before going live
- Quickly re-running a batch of previously defined configurations after making a code change to your strategy
Setting Up a Benchmark
- Navigate to the Backtest section from the sidebar, then look at the tab bar in the top-left area of the page and select the Benchmark icon.
- Click Add Configuration to define your first backtest configuration. Each configuration includes the same inputs as a regular backtest: exchange, symbol, timeframe, strategy, date range, and starting balance.
- Repeat step 2 for each additional configuration you want to include in the benchmark.
- Once all configurations are set up, use the batch controls at the top of the page to run them.
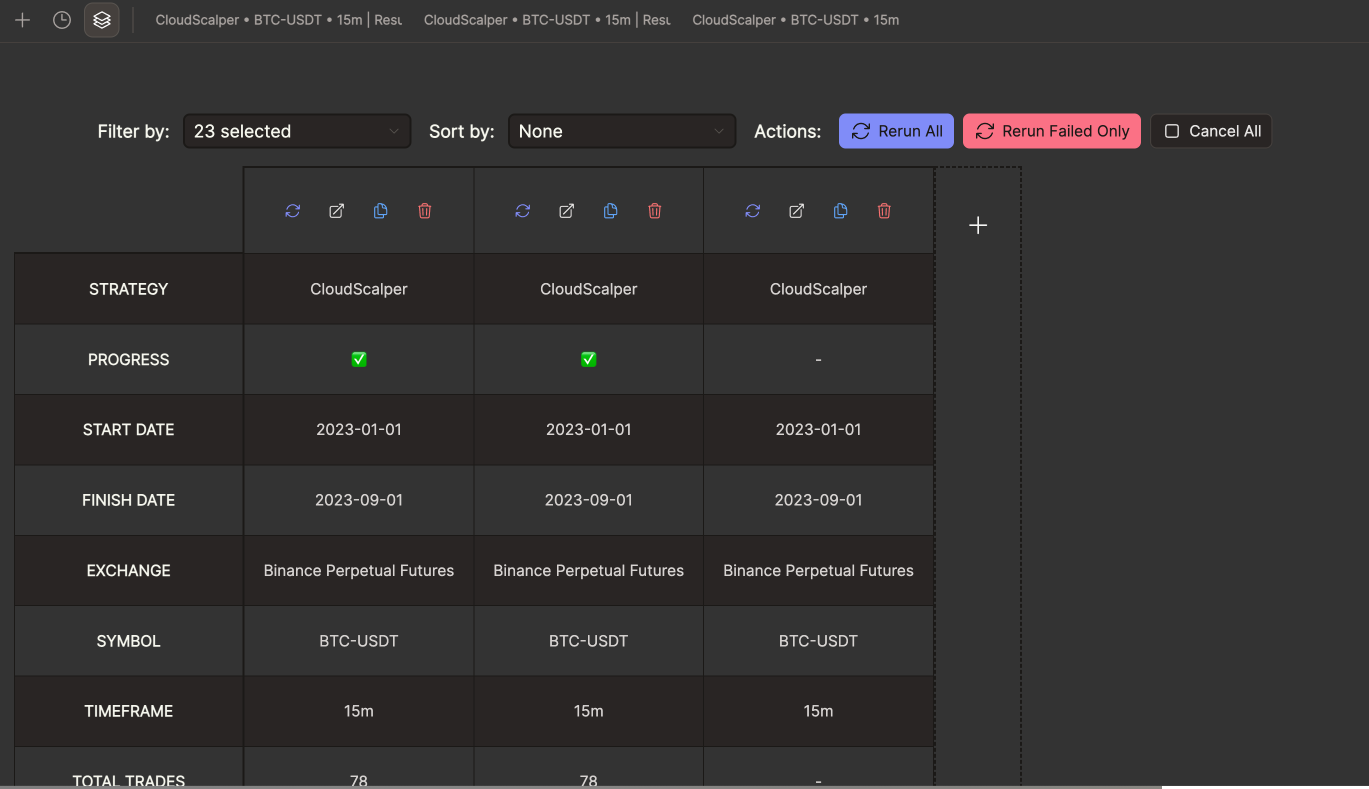
Batch Controls
The toolbar at the top of the Benchmark page provides controls that act on all configurations at once:
| Control | Description |
|---|---|
| Run All | Starts all configurations that have not yet been run (or have been reset) simultaneously |
| Stop All | Cancels all currently running backtests |
Individual configurations also have their own Run, Stop, and Reset buttons, so you can rerun a single configuration without affecting the rest of the batch.
Comparing Results
Once the backtests finish (they run in parallel, so the total time is roughly equal to the longest single backtest), the results table populates with a row per configuration. The columns include all key metrics:
- Net Profit
- Win Rate and Total Trades
- Max Drawdown
- Sharpe, Sortino, and Calmar Ratios
- Annual Return
You can sort the table by any column to instantly rank your configurations by whatever metric matters most to you. Clicking on a row expands the full results for that configuration, including the equity curve and trade list.