


Backtest
Assuming you already have created your first strategy and imported historical candles for your strategy, it is time to actually backtest it:
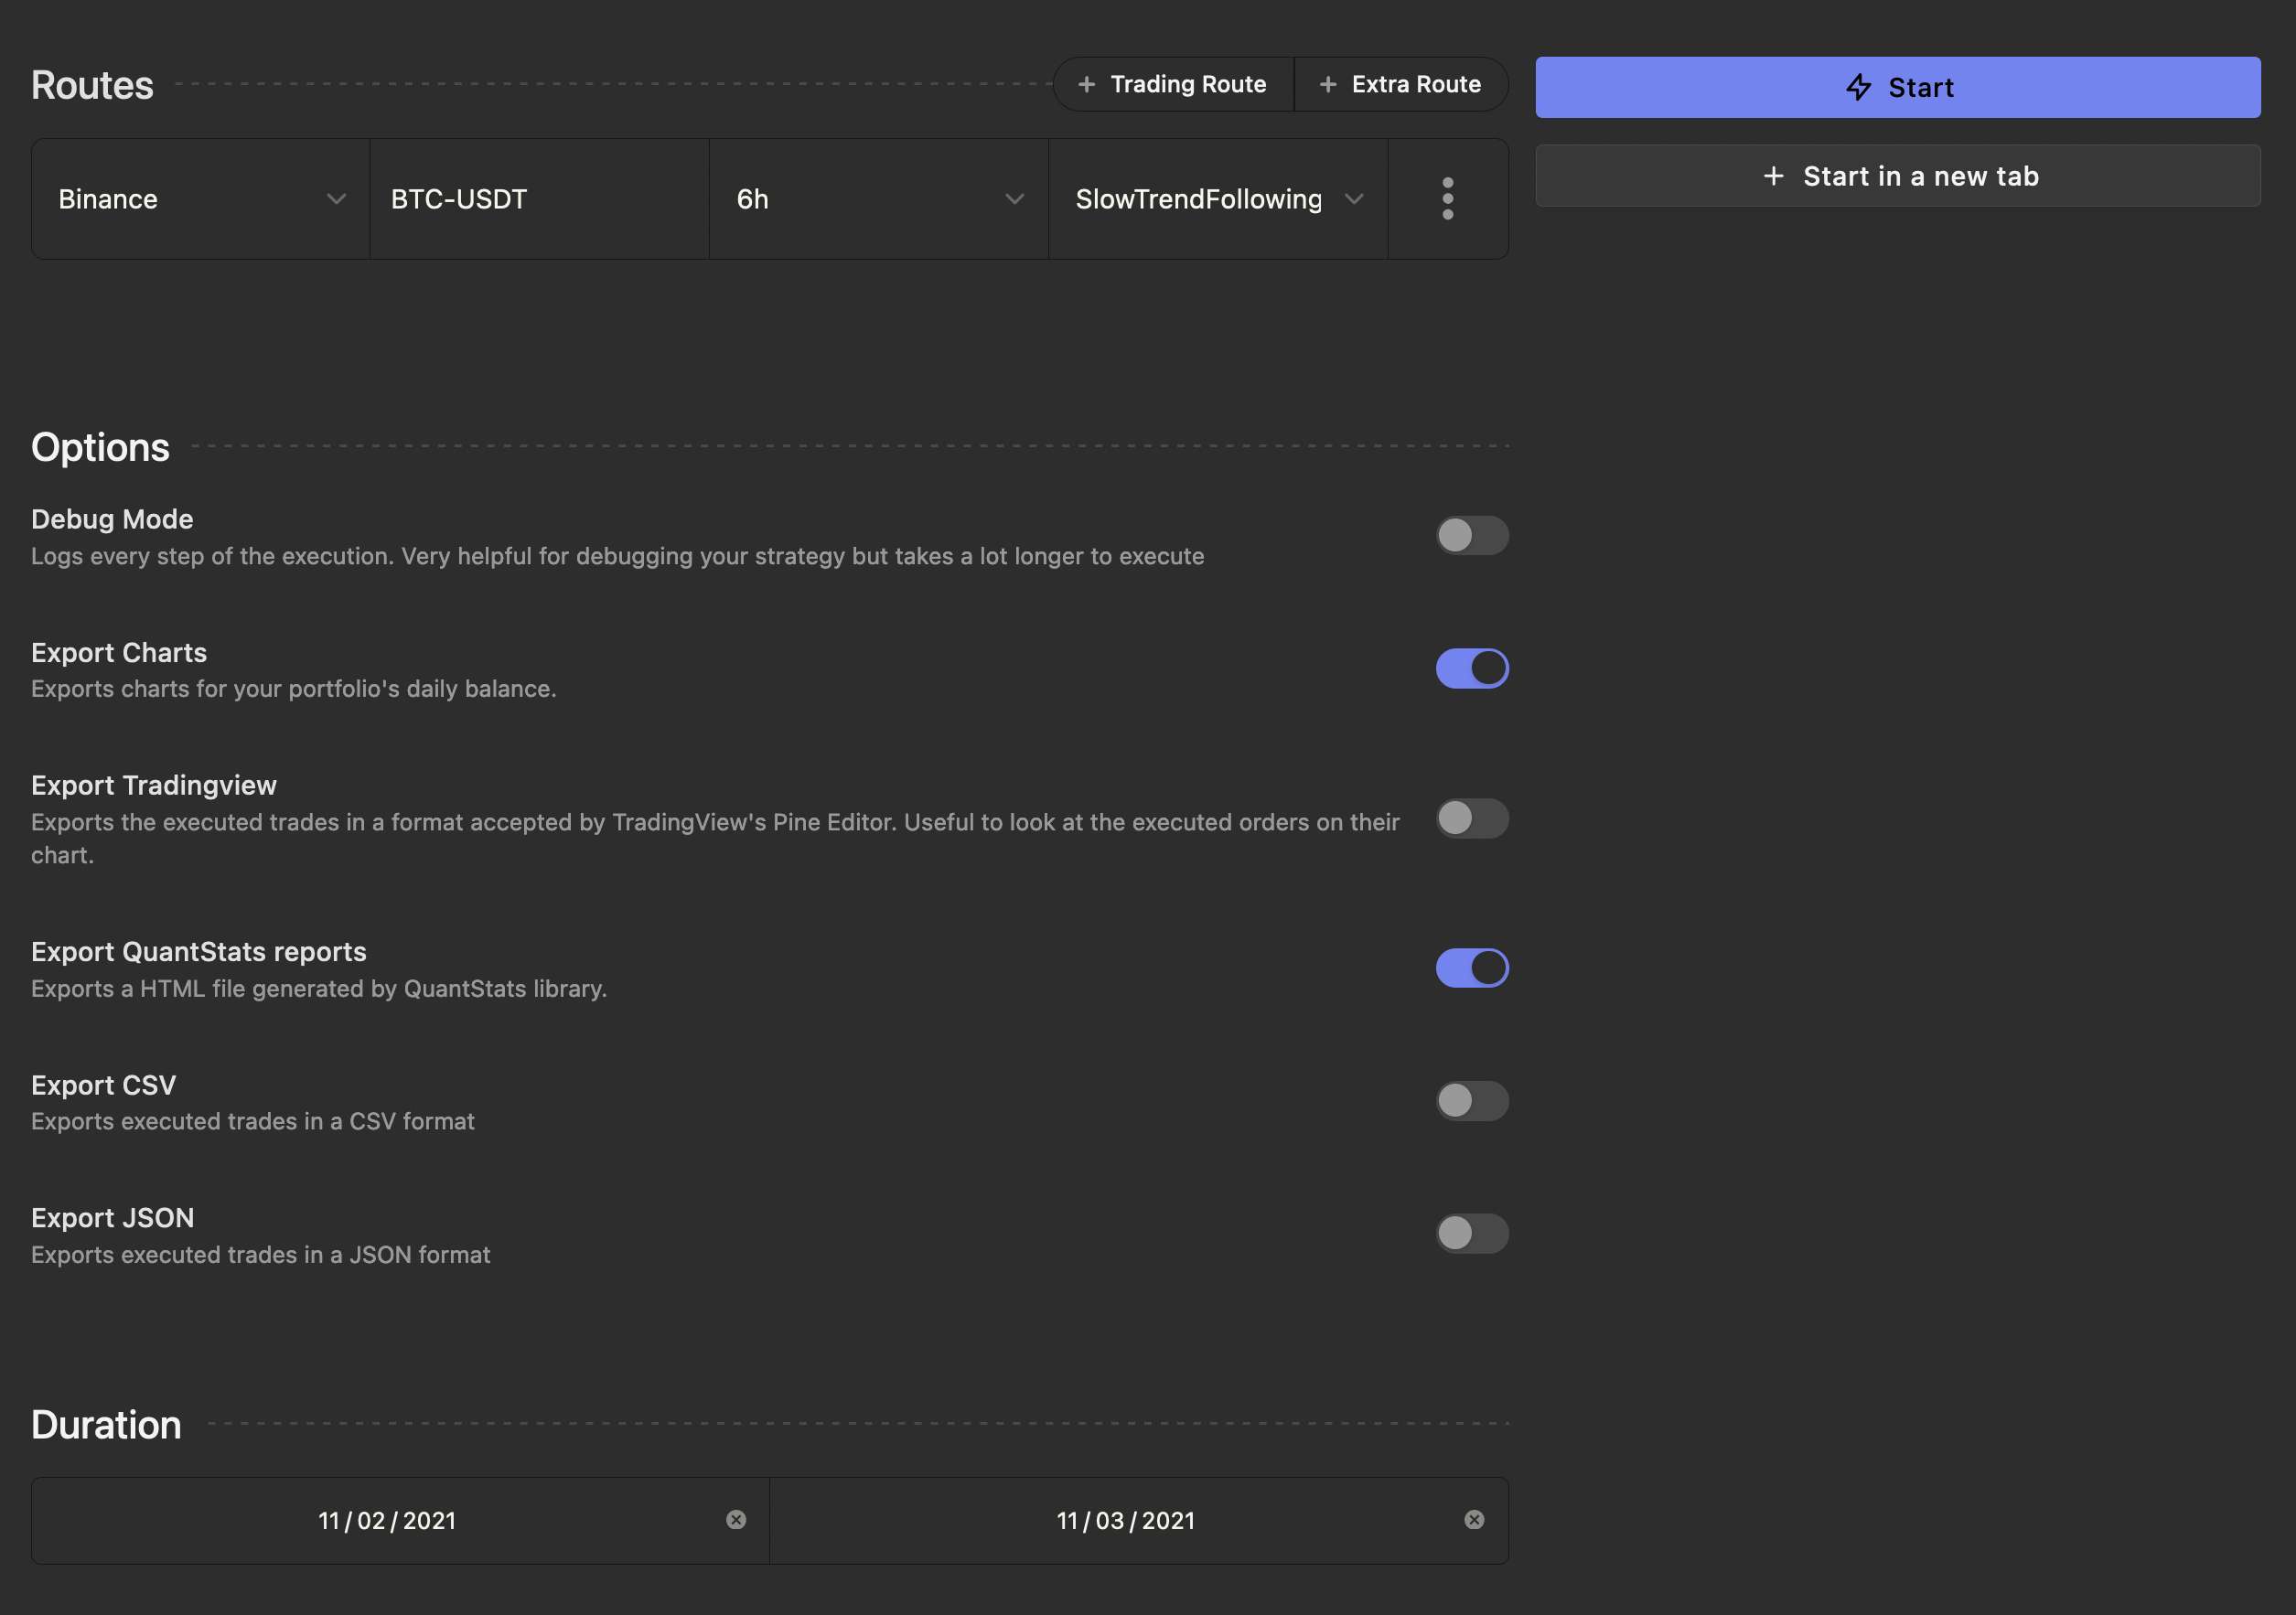
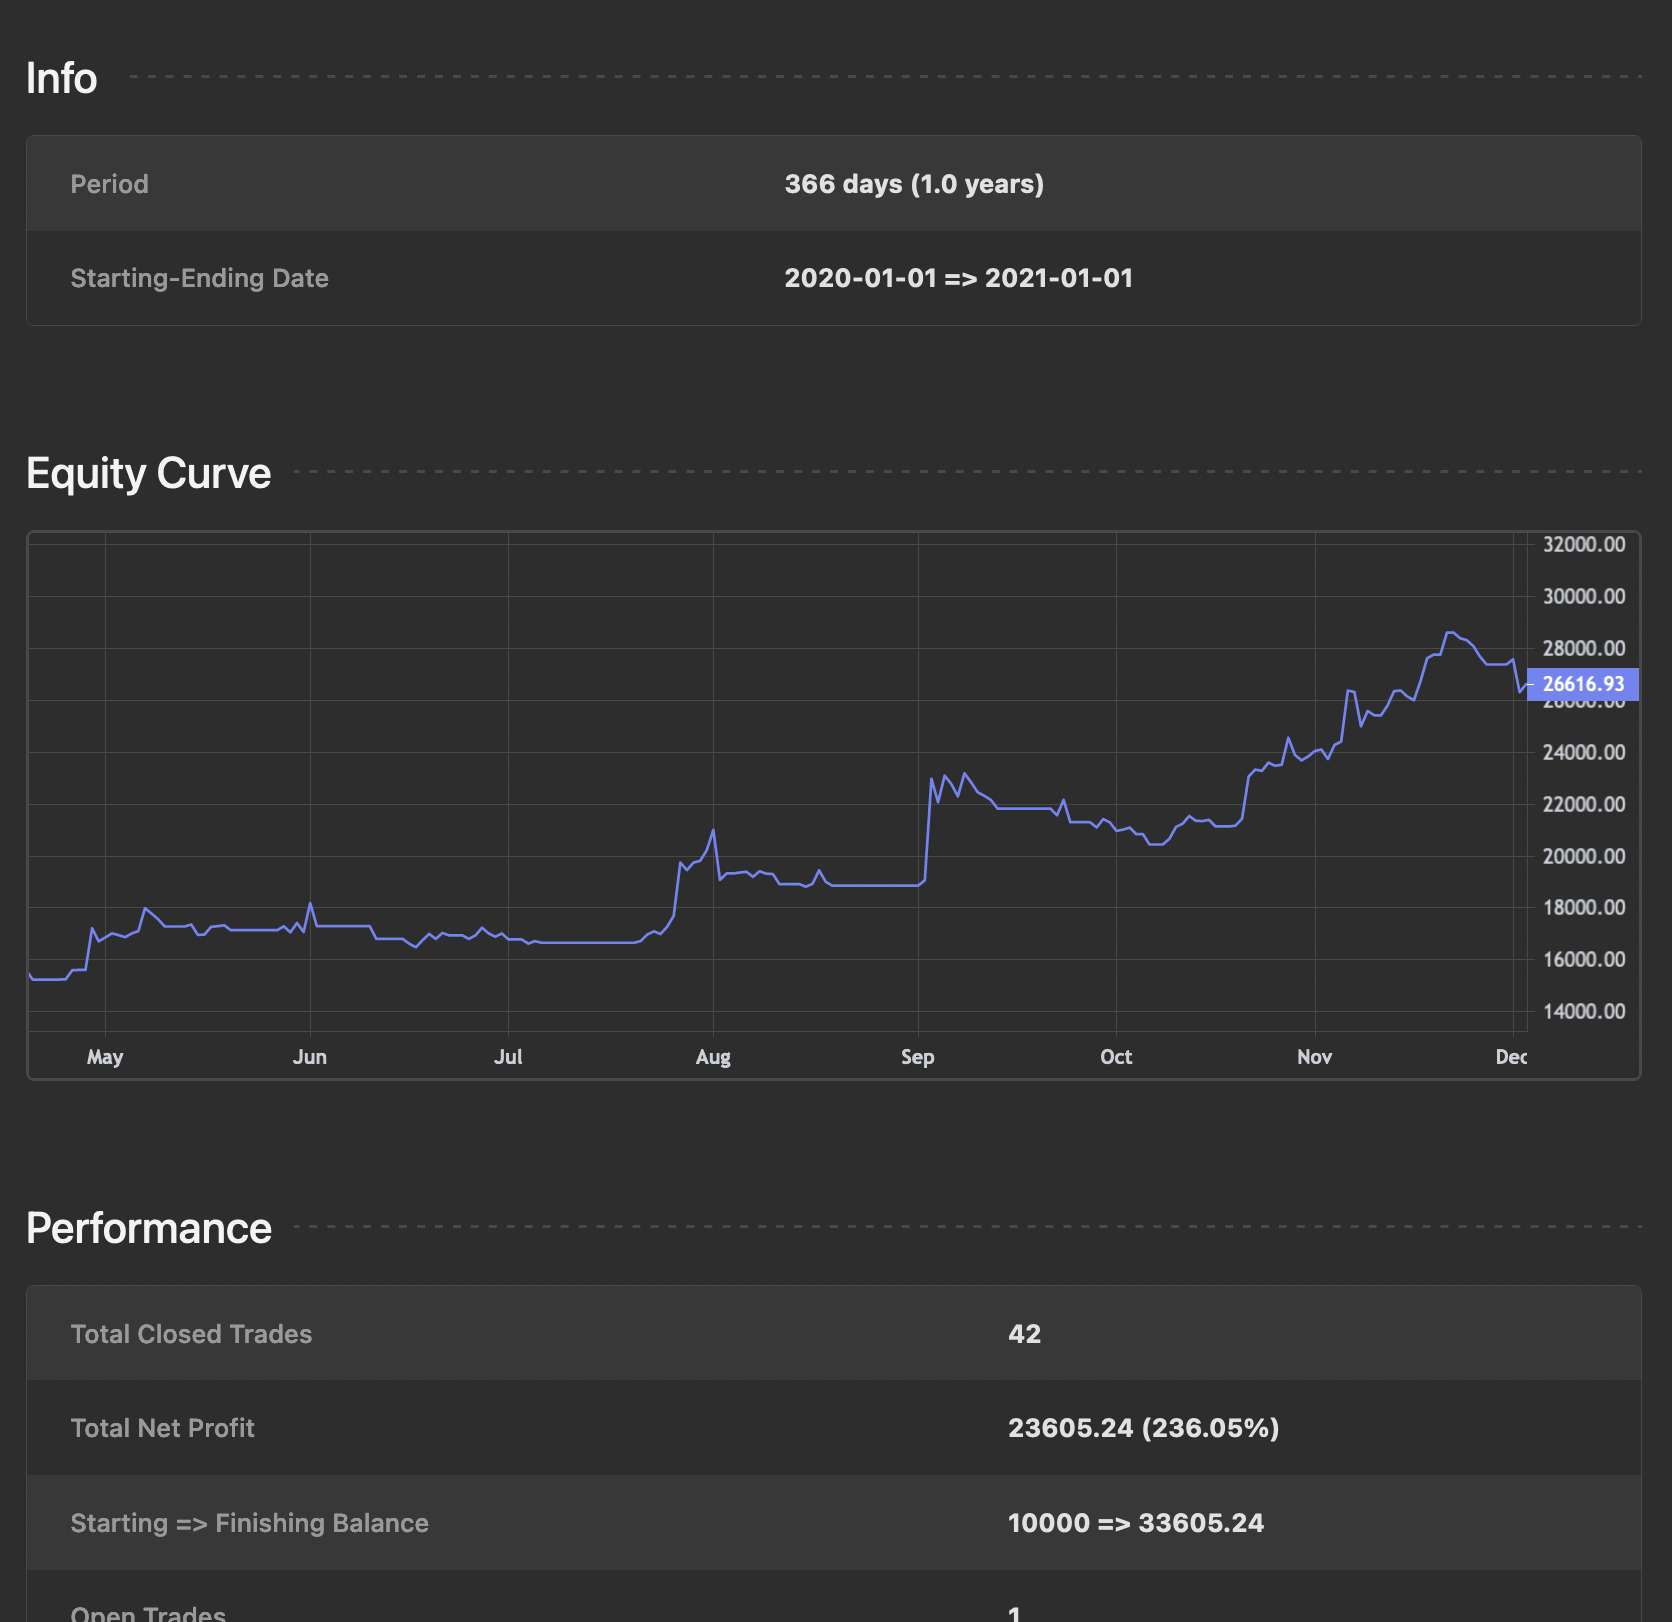
After choosing the routes, press the "Start" button. And here are the results:
Charts
Other than the chart that you see in the metrics section, there are also two "Legacy Charts" which you can enable by toggling the "Export Charts" checkbox in the backtesting options section. These two charts will be moved into the metrics section in the future.
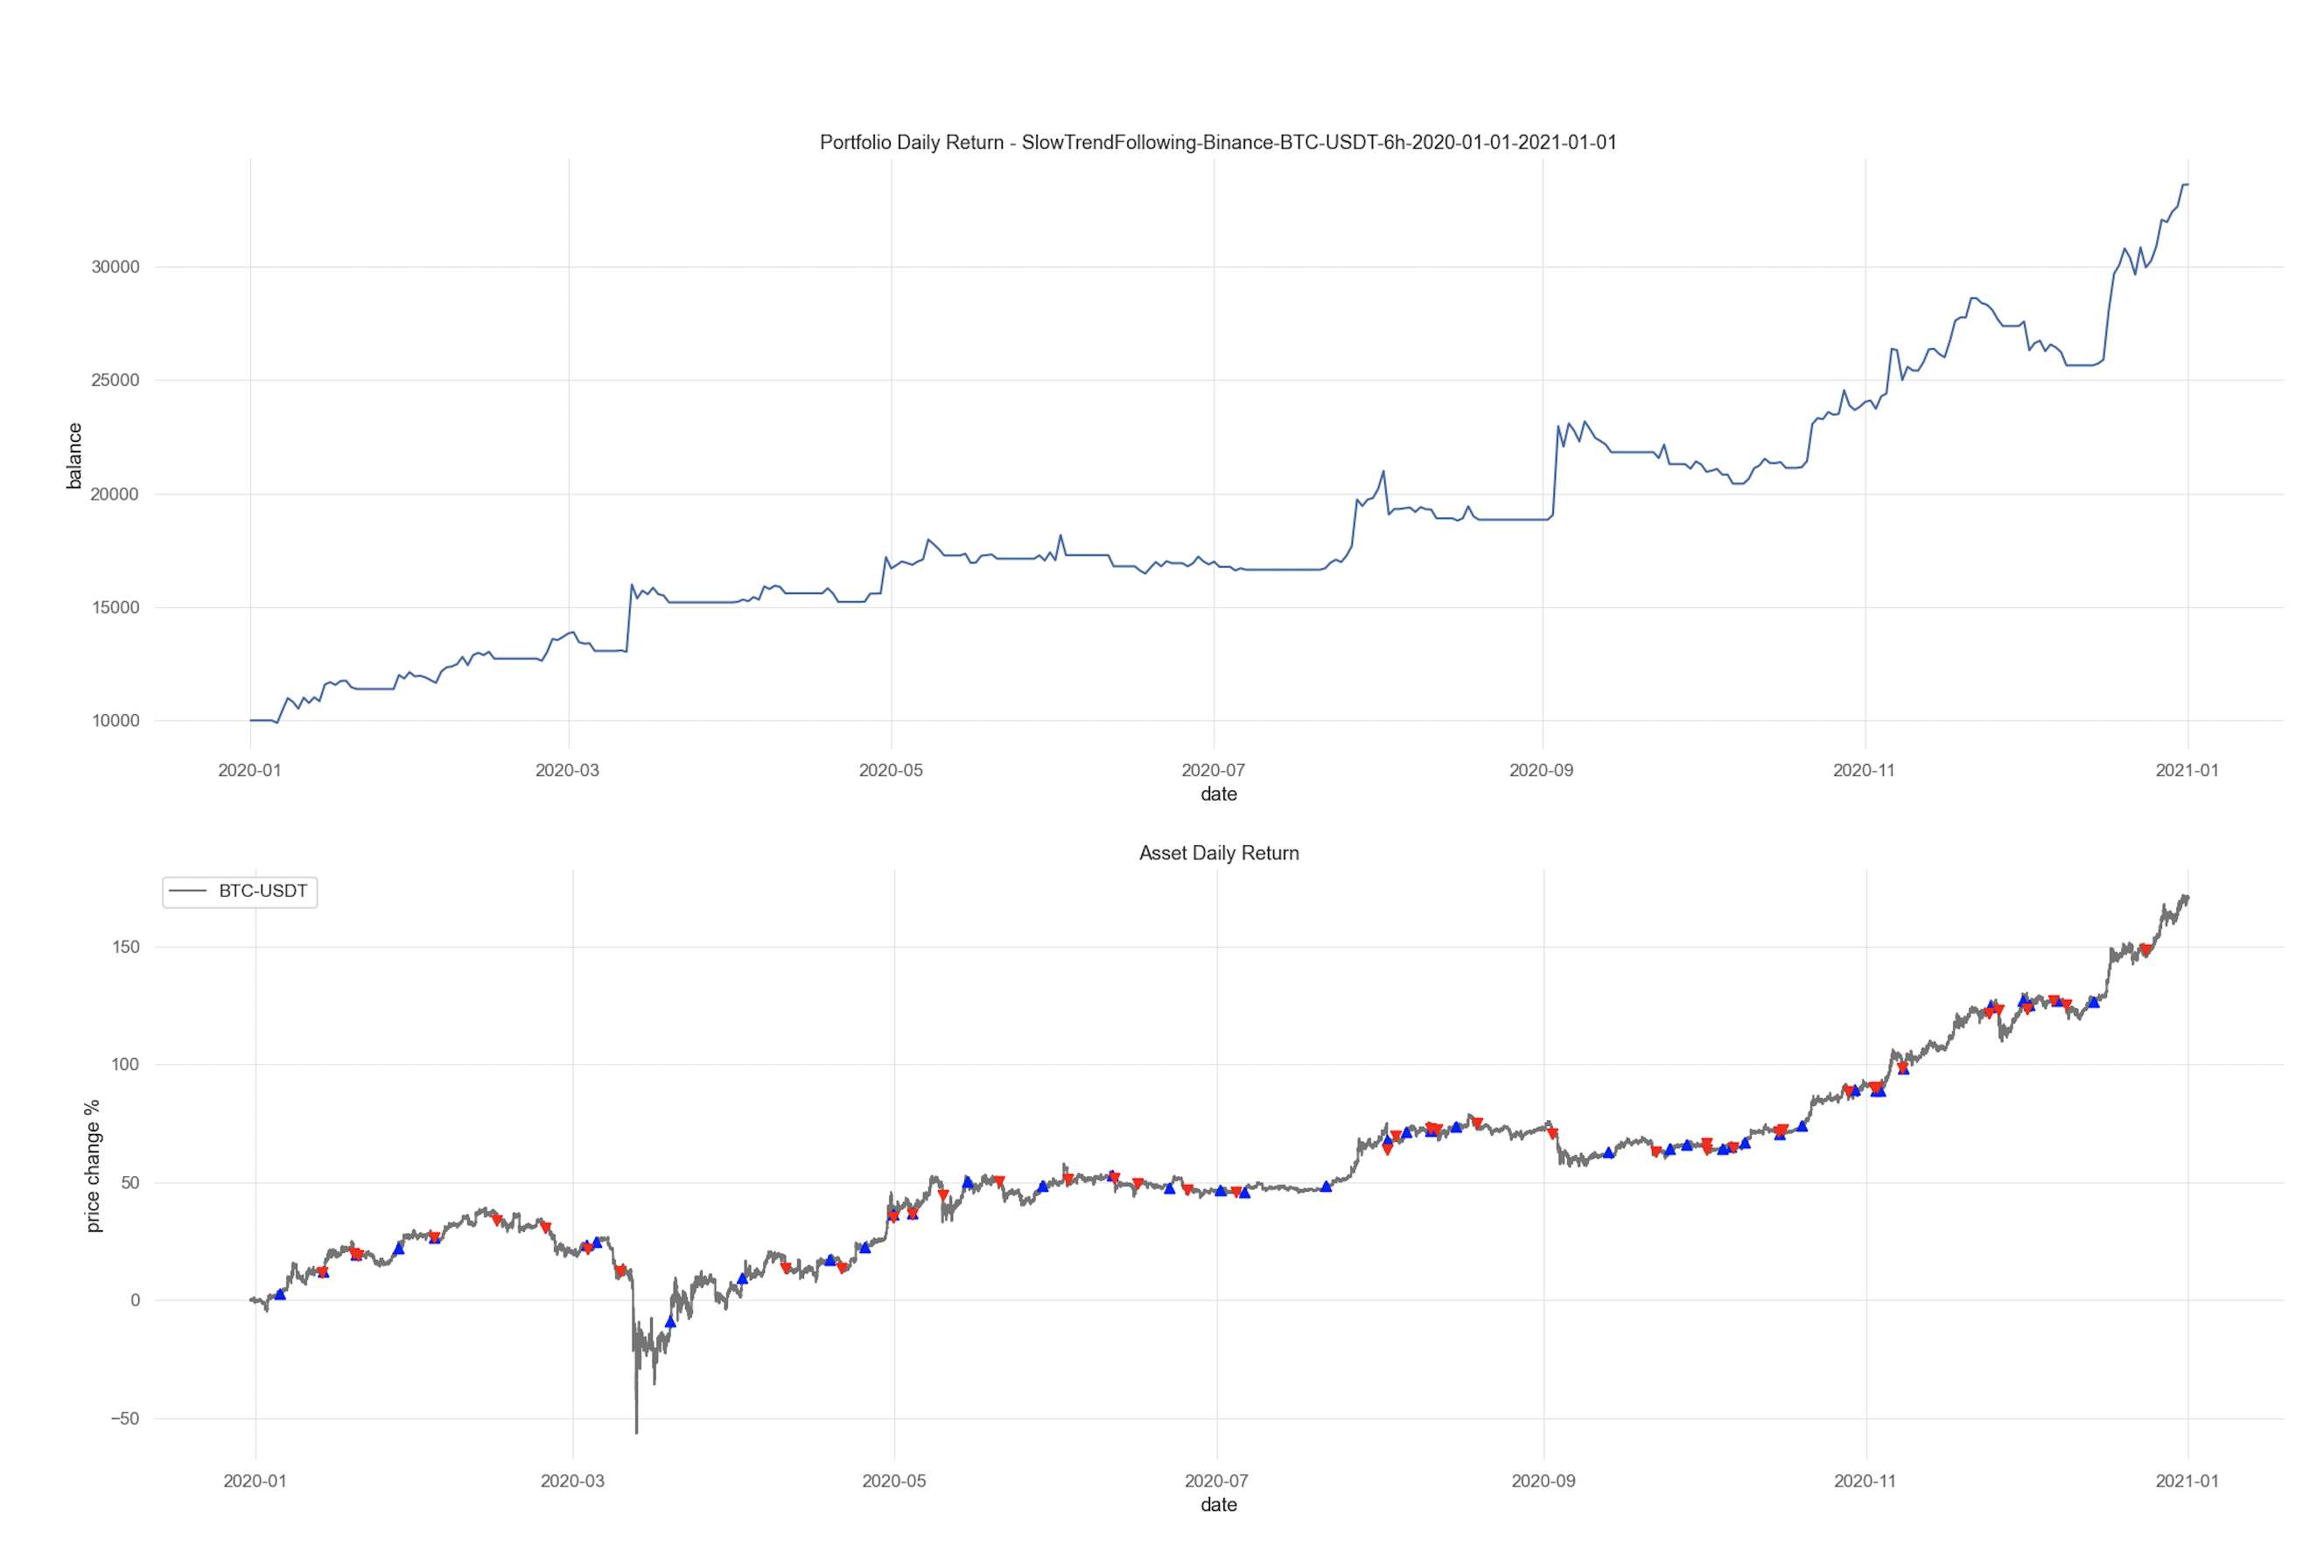
After the backtest is finished, you can download the charts by pressing the "Legacy Chart" button. Here is an example of the charts:
Quantstats Report
Enabling the "Export QuantStats reports" checkbox will generate a QuantStats report in the HTML format for you. This report is very detailed and has a lot of useful information and charts about your portfolio's performance.
Here's an example Quantstats report file which you can see in your browser.
TradingView
This feature is useful for those who use TradingView for their chart needs. To enable it, you need to check the "Export Tradingview" option in the backtest form.
At the end of the process, you will be able to download a .txt file with a pine script as content. Then open the file, copy its content, and paste it inside TradingView's Pine Editor. Now click on "Add to chart" and you will see entries and exits of the strategy.
WARNING
Make sure to see the chart in the same timeframe as the backtest simulation was executed. Also, only the last ~30 trades are displayed because of a limit on TradingView's side.
WARNING
The numbers in Tradingview's backtesting metrics are usually different than what you see in Jesse's. That is perfectly normal considering that Tradingview is not primarily a backtesting software, and its results are not to be counted on. Jesse however, is.
CSV
Jesse can output completed trades into a CSV file. You may open this CSV file with Excel, Google sheets, or whatever tool you like to analyze completed trades, draw further charts, etc.
To use it, check the "Export CSV" option in the backtesting form. Once the backtest is completed, Jesse will print the path to the CSV file which you can download.
JSON
Jesse can output completed trades into a file in JSON format. The JSON format is a popular javascript format that is usually used to create APIs on the web.
Check the "Export JSON" option in the backtesting form to use it. Once the backtest is complete, Jesse will print the path to the JSON file.
Visual analysis of completed trades
There is a tool called "Jesse trades info" made by one of the community members. It helps to parse JSON backtest files and to display them in a convenient way using tables and charts.
You can find screenshots and a video on its Github repository page.
