

Candles
We provide a few handful functions that allow you to:
- Create (even fake) candles
- Store candles in the database
- Fetch candles from the database
- Plot candles
They can be quite useful for doing research in Jupyter notebooks or when writing your own custom scripts.
import_candles
The equivalent to the import candles mode in the GUI dashboard.
Useful for operations such as a script to batch-import candles for a list of symbols.
Returns the success message in the string format after a successful import. By default, a progress bar is shown which is helpful in environments such as Jupyter notebooks but it can be disabled by setting show_progress_bar to False.
import_candles(exchange, symbol, start_date, show_progressbar=True)Properties:
- exchange: str
- symbol: str
- start_date: str
- show_progressbar: bool (default: True)
Return Type: str
store_candles
Stores candles in the database. The stored data can later be used for being fetched again via get_candles or even for running backtests on them.
A common use case for this function is for importing candles from a CSV file so you can later use them for backtesting.
store_candles(candles, exchange, symbol)WARNING
Jesse uses 1m timeframe candles and generates others as needed on the fly. So the candles you pass to this function must be in the 1m timeframe.
Properties:
- candles: np.ndarray
- exchange: str
- symbol: str
Return Type: None
Example:
close_prices = [10, 11, 12, 12, 11, 13, 14, 12, 11, 15]
np_candles = research.candles_from_close_prices(close_prices)

research.store_candles(np_candles, 'Test Exchange', 'BTC-USDT')
get_candles
Fetches candles from the database and returns them as a NumPy array with the same structure that Jesse's self.candles does.
Returns both warm-up candles and the actual trading candles that you requested. If warmup_candles_num is passed as 0, then it will only return None for the warm-up candles. Either way, it will always return two values.
If you pass a warmup_candles_num greater than 0, then it will return that many warm-up candles. These warm-up candles are quite useful if you're trying to execute backtests using Jesse's backtesting function of the research module.
Also, is_for_jesse is a flag that should be set to True if you're going to use the returned candles for running backtests using Jesse's backtesting function. This is because Jesse expects the candles to be in a specific format, and this flag will ensure that the returned candles are in that format. However, if you're going to simply use those candles for any other use case, such as plotting them on a chart, then pass it as False.
get_candles(exchange, symbol, timeframe, start_date_timestamp, finish_date_timestamp, warmup_candles_num=0, caching=False, is_for_jesse=False)Properties:
- exchange: str
- symbol: str
- timeframe: str (supported:
1m,3m,5m,15m,30m,1h,2h,3h,4h,6h,1D) - start_date_timestamp: int
- finish_date_timestamp: int
- warmup_candles_num: int (default: 0)
- caching: bool (default: False)
- is_for_jesse: bool (default: False)
Return Type: Tuple[np.ndarray, np.ndarray]
Example 1:
warmup_candles, trading_candles = research.get_candles('Binance Spot', 'ETH-USDT', '4h', 1564272000000, 1569628800000)

print(warmup_candles)
# None

print(trading_candles[0])
# array([
#     1.56427200e+12, # timestamp
#     2.07300000e+02, # open
#     2.07750000e+02, # close
#     2.08230000e+02, # high
#     2.06170000e+02, # low
#     2.15143531e+04 # volume
# ])
Example 2:
import jesse.helpers as jh

warmup_candles, trading_candles = get_candles(
    'Binance Spot', 'BTC-USDT', '4h', jh.date_to_timestamp('2020-01-25'), jh.date_to_timestamp('2020-03-25'),
    warmup_candles_num=210, caching=True, is_for_jesse=True
)

trading_candles = {
    jh.key('Binance Spot', 'BTC-USDT'): {
        'exchange': 'Binance Spot',
        'symbol': 'BTC-USDT',
        'candles': trading_candles,
    },
}
warmup_candles = {
    jh.key('Binance Spot', 'BTC-USDT'): {
        'exchange': 'Binance Spot',
        'symbol': 'BTC-USDT',
        'candles': warmup_candles,
    },
}

# Now we are ready to run backtests with these candles.
fake_candle
Generates a fake candle. If attributes are passed, then it'll create using those values. Else, it will generate one.
If reset is passed as True, then all values including timestamp will be reset (and no longer will look like a price series)
candlestick_chart(attributes, reset)Properties:
- attributes: dict
- reset: bool = False
Return Type: np.ndarray
Example:
# example without attributes
c1 = research.fake_candle()
print(c1)
# output:
# [1.60945986e+12 9.70000000e+01 1.02000000e+02 1.02000000e+02
#  9.60000000e+01 2.20000000e+01]

# example with attributes
c2 = research.fake_candle({
    'timestamp': 1643104557000,
    'open': 10,
    'close': 11,
    'high': 12,
    'low': 8,
    'volume': 200,
})
print(c2)
# output:
# [1.64310456e+12 1.00000000e+01 1.10000000e+01 1.20000000e+01
#  8.00000000e+00 2.00000000e+02]
See Also: fake_range_candles, candles_from_close_prices
fake_range_candles
Similar to fake_candle, but generates a range of candles as many as you pass.
fake_range_candles(count)Properties:
- count: int
Return Type: np.ndarray
Example:
range_candles = research.fake_range_candles(3)
print(range_candles)
# output:
# [[1.60945920e+12 1.06000000e+02 1.09000000e+02 1.09000000e+02
#   1.05000000e+02 9.70000000e+01]
#  [1.60945926e+12 1.09000000e+02 1.10000000e+02 1.10000000e+02
#   1.08000000e+02 1.50000000e+01]
#  [1.60945932e+12 1.10000000e+02 1.17000000e+02 1.17000000e+02
#   1.09000000e+02 2.00000000e+00]]
See Also: fake_candle, candles_from_close_prices
candles_from_close_prices
Generates a numpy array of candles from a list of close prices.
This is very helpful for when you have a range of close prices, and intend to run backtest on them. Because backtesting requires you to have candles (and not merely close prices), you can use this function to generate candles from close prices.
The first candle has the timestamp of 1609459200000 (2021-01-01T00:00:00+00:00) and after that, each has the timestamp of the previous candle plus 1 minute.
candles_from_close_prices(prices)Properties:
- prices: list
Return Type: np.ndarray
Example:
close_prices = [10, 11, 12, 12, 11, 13, 14, 12, 11, 15]
np_candles = research.candles_from_close_prices(close_prices)

print(np_candles)
# output:
# [[1.60945920e+12 9.50000000e+00 1.00000000e+01 1.00000000e+01
#   9.50000000e+00 1.00000000e+02]
#  [1.60945926e+12 1.00000000e+01 1.10000000e+01 1.10000000e+01
#   1.00000000e+01 2.80000000e+01]
#  [1.60945932e+12 1.10000000e+01 1.20000000e+01 1.20000000e+01
#   1.10000000e+01 1.30000000e+02]
#  [1.60945938e+12 1.20000000e+01 1.20000000e+01 1.20000000e+01
#   1.20000000e+01 7.50000000e+01]
#  [1.60945944e+12 1.20000000e+01 1.10000000e+01 1.20000000e+01
#   1.10000000e+01 1.51000000e+02]
#  [1.60945950e+12 1.10000000e+01 1.30000000e+01 1.30000000e+01
#   1.10000000e+01 5.10000000e+01]
#  [1.60945956e+12 1.30000000e+01 1.40000000e+01 1.40000000e+01
#   1.30000000e+01 1.68000000e+02]
#  [1.60945962e+12 1.40000000e+01 1.20000000e+01 1.40000000e+01
#   1.20000000e+01 2.20000000e+01]
#  [1.60945968e+12 1.20000000e+01 1.10000000e+01 1.20000000e+01
#   1.10000000e+01 1.44000000e+02]
#  [1.60945974e+12 1.10000000e+01 1.50000000e+01 1.50000000e+01
#   1.10000000e+01 1.80000000e+02]]
See Also: fake_candle, fake_range_candles
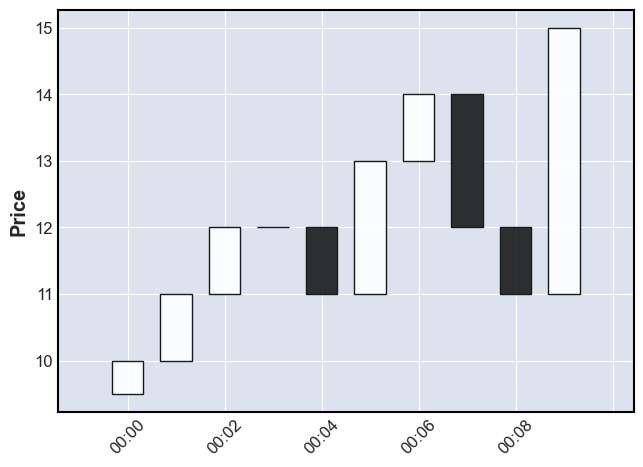
candlestick_chart
Displays a candlestick chart from candles in numpy array format (which is the default for Jesse).
candlestick_chart(candles)Properties:
- candles: np.ndarray
Return Type: None
Example:
# generate fake candles from close prices
close_prices = [10, 11, 12, 12, 11, 13, 14, 12, 11, 15]
np_candles = research.candles_from_close_prices(close_prices)

candlestick_chart(np_candles)
Which would display: